In science, we have been learning how materials change state and in maths, we have been looking at statistics in maths and how to read and draw tally charts, bar charts and line graphs – so it seemed like the perfect opportunity to use chocolate to investigate our theme in a little more detail!
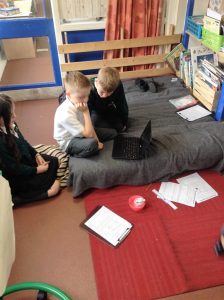
To complete the tally charts, we quizzed year 4 on their preferred chocolate flavours and then converted the results into a bar chart – making sure we had a correct scale and appropriate labels.
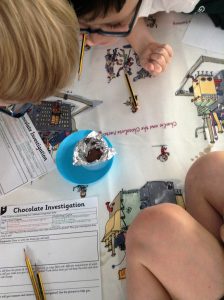
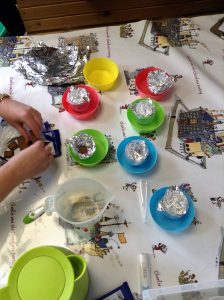
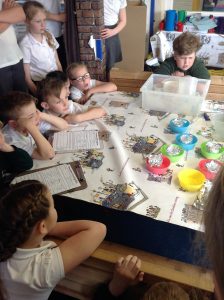
To generate data for our line graph, we investigated how quickly chocolate melted and compared the temperature of the water as it cooled the chocolate! Class 10 showed great restraint with all the melted chocolate around the class room!


