
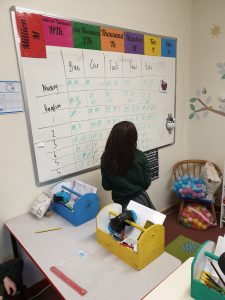
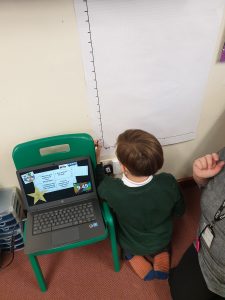
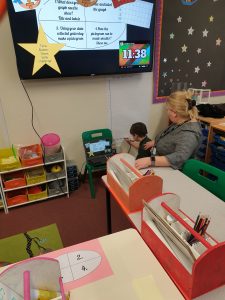
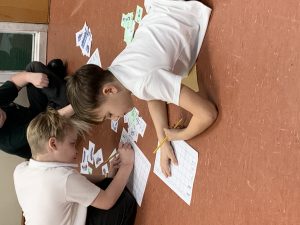
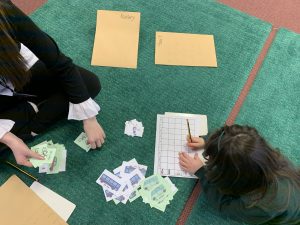
This week In Basecamp, we collected data from across the school to see how everyone travels to school each day! We used the data to make pictograms and bar charts…
This week In Basecamp, we collected data from across the school to see how everyone travels to school each day! We used the data to make pictograms and bar charts…