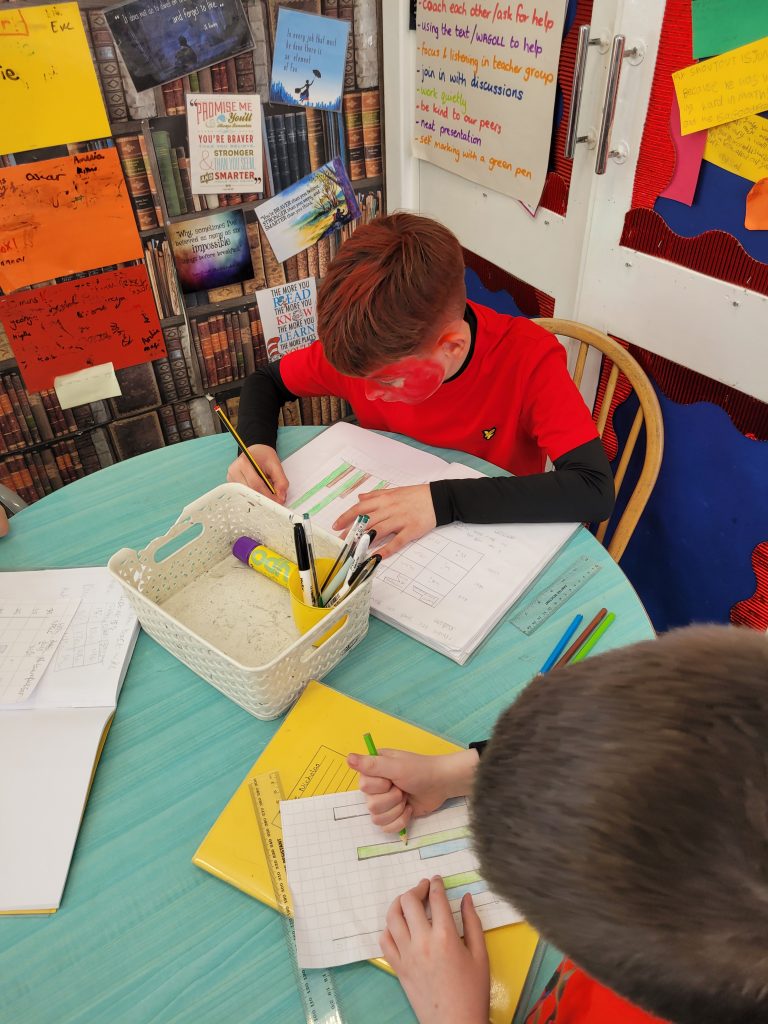
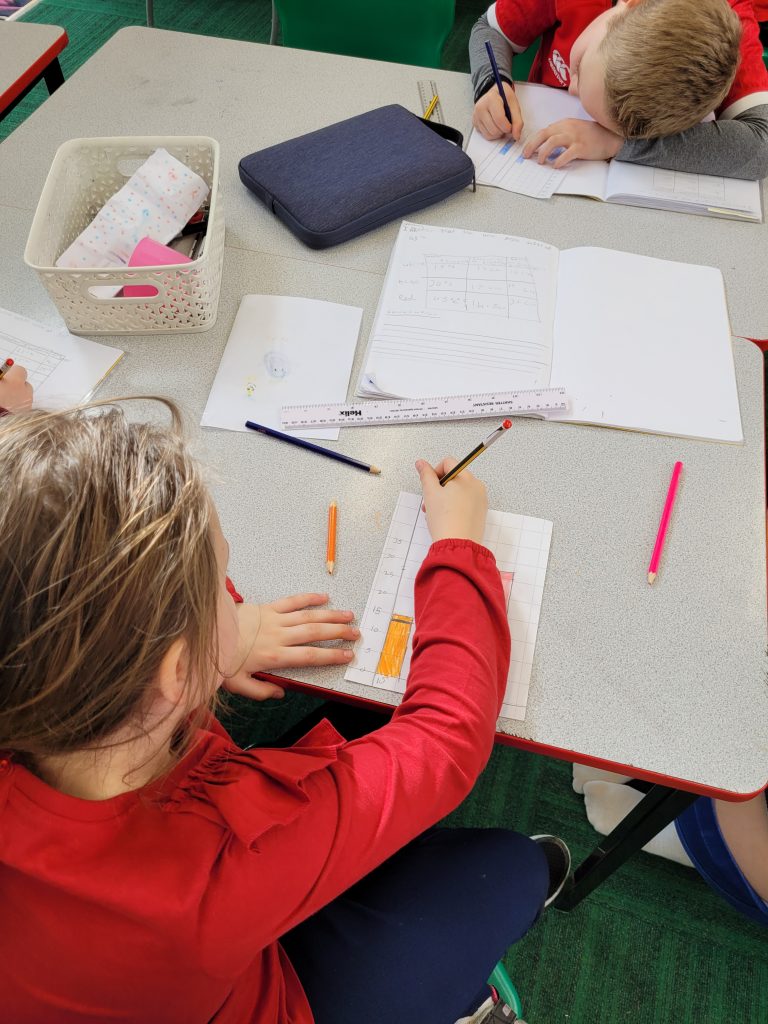
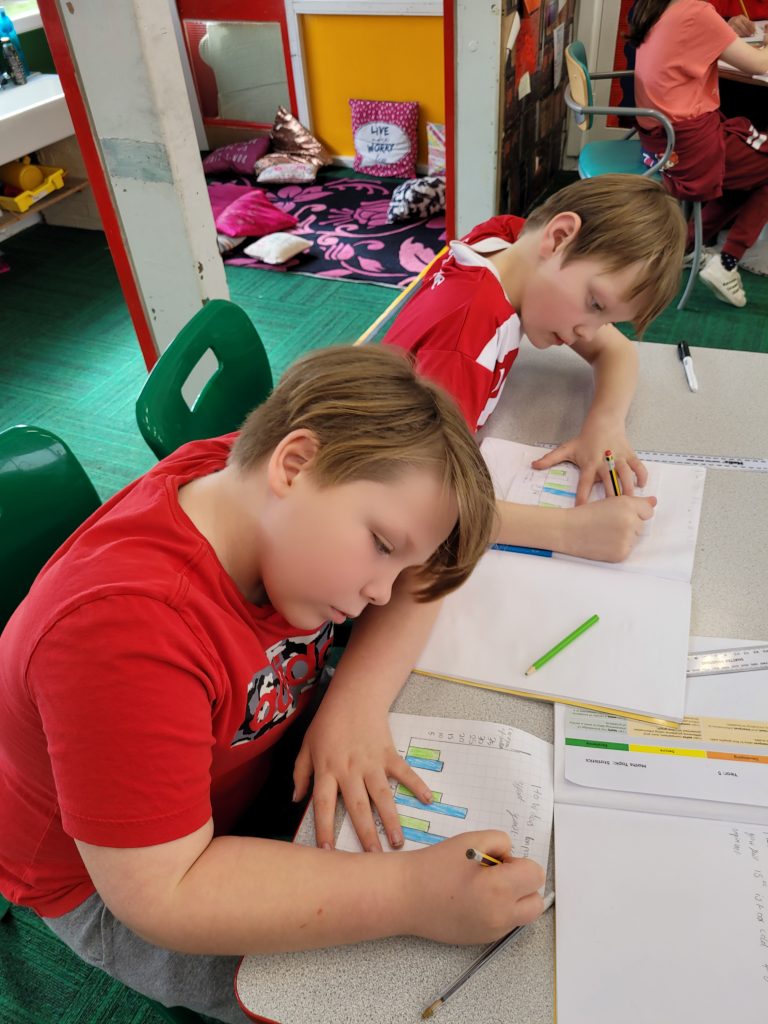
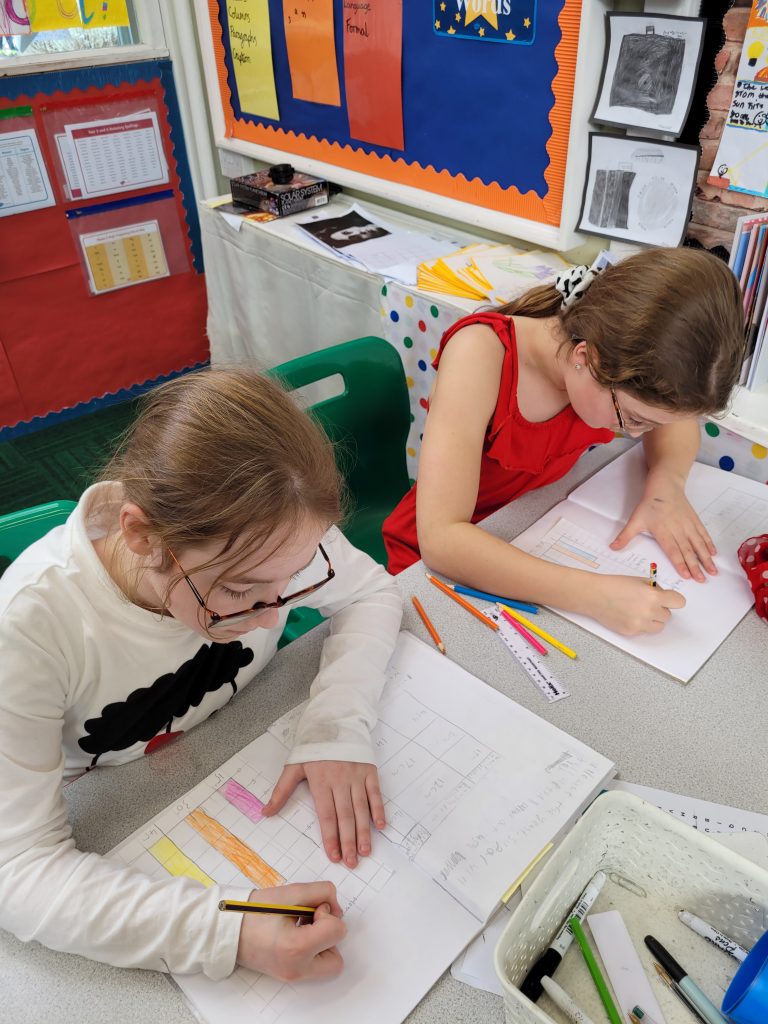
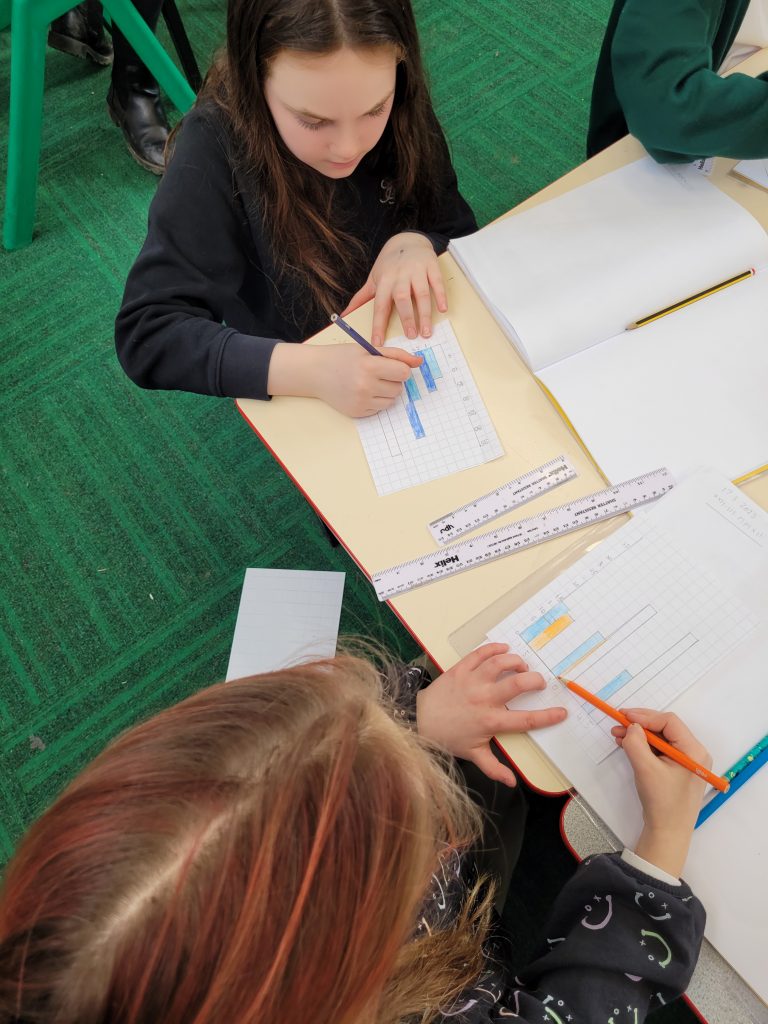
After completing our experiment to see how the temperature effects the growth of yeast, we presented our results using a bar chart.
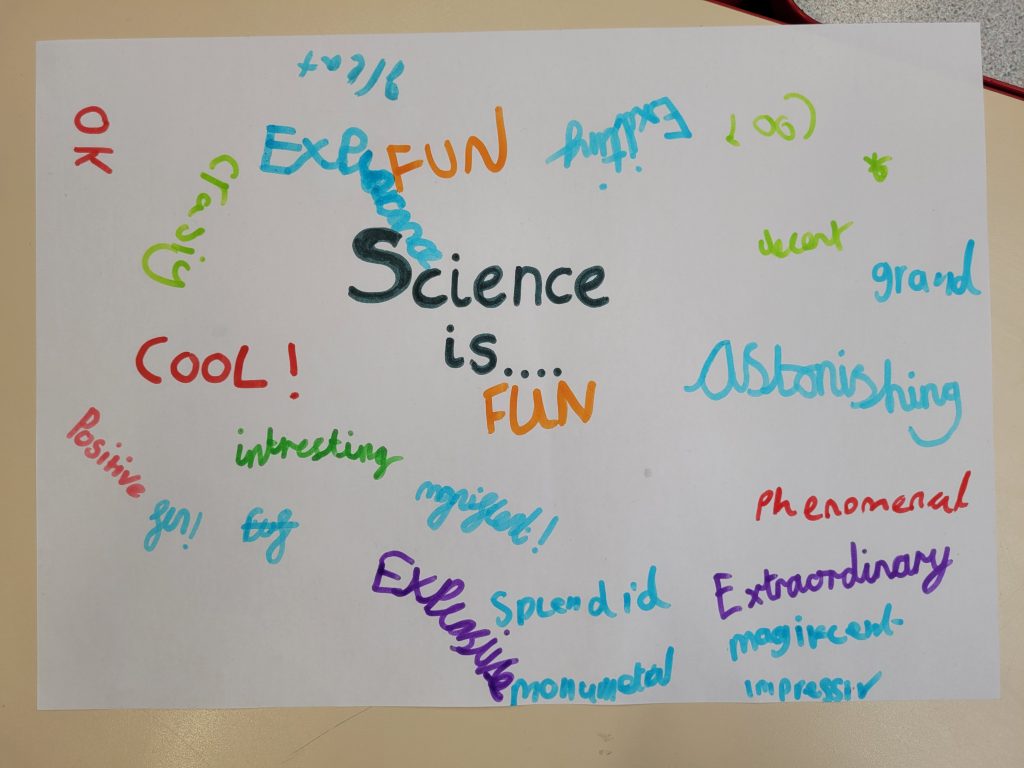
In crew, we talked about all the science we have done this week. Finally, we created a poster to show what we think about science.